
Table of Contents >> Show >> Hide
- First, What Does “Expensive” Even Mean in Stocks?
- The Market’s Price Tag in Mid-January 2026: A Snapshot
- Valuation Gauge #1: Forward P/E (The Market’s “Expected Earnings” Price)
- Valuation Gauge #2: Trailing P/E (The “No-Excuses” Price)
- Valuation Gauge #3: Shiller CAPE (The “Long Memory” Metric)
- Valuation Gauge #4: Price-to-Sales (When Even Revenue Looks Pricier)
- Valuation Gauge #5: Price-to-Book (Trickier in a Tech-Heavy Market)
- Rates Reality Check: Stocks vs. Treasurys (The “Fed Model” Vibe)
- So… Is the Market Expensive Right Now?
- Why Prices Can Stay High Anyway (Yes, Even When Everyone Notices)
- What “Expensive” Means for You (Without the Drama)
- A Practical Playbook for Investing When Valuations Are High
- Bottom Line
- Real-World Investor Experiences: What It Feels Like to Invest When the Market Looks “Pricy”
If the stock market were a pair of jeans, you’d want to know: am I buying these on clearance, or am I paying “limited edition”
prices for something that will be 40% off next month? That’s basically what investors mean when they ask whether the market is
“cheap” or “expensive”they’re asking if today’s prices make sense relative to what corporations are actually producing
(earnings, cash flow, sales) and what investors can earn elsewhere (like Treasury bonds).
The catch is that “cheap vs. expensive” is not one number. It’s a bundle of measurements, each with blind spotslike checking
your outfit in a mirror with a smudge right where your hair is. Still, when several valuation gauges point in the same direction,
you can make smarter decisions about expectations, risk, and how aggressively (or cautiously) to invest.
First, What Does “Expensive” Even Mean in Stocks?
In everyday life, expensive means “costs a lot.” In the stock market, expensive means “costs a lot relative to fundamentals.”
A $300 stock can be cheap if its profits are exploding. A $30 stock can be expensive if its business is shrinking.
For the overall U.S. market, “fundamentals” typically means some combination of:
earnings (profits), sales (revenue), book value (net assets), and dividends (cash returned to shareholders).
Add in interest ratesbecause a world where safe bonds yield 5% is not the same as a world where safe bonds yield 1%and you’ve
got the main ingredients in the valuation recipe.
The Market’s Price Tag in Mid-January 2026: A Snapshot
As of mid-January 2026, the big-picture indicators widely followed by U.S. investors paint a consistent theme: U.S. equities look
richly priced compared to their own long-term history. That doesn’t automatically mean a crash is scheduled for Tuesday. It does
mean future returns may have less “easy money” tailwind, and investors should think more like a shopper with a budget than a
kid in a candy store.
Quick-read table: what investors are watching
| Metric | What it tells you | Why it matters right now |
|---|---|---|
| Forward P/E | Price today vs. expected next-12-month earnings | High forward P/E = investors paying up for growth |
| Trailing P/E | Price today vs. last-12-month reported earnings | Shows how pricey the market is versus “already happened” profits |
| Shiller CAPE | Price vs. 10-year inflation-adjusted earnings average | Historically high CAPE often implies lower long-term returns |
| Price-to-Sales | Price vs. revenue | Harder to “engineer” than earnings; very elevated can be a red flag |
| Earnings Yield | Inverse of P/E (earnings per $ invested) | Useful for comparing stocks to bond yields |
| Dividend Yield | Cash payouts per $ invested | Lower yields can signal higher prices (or more buybacks) |
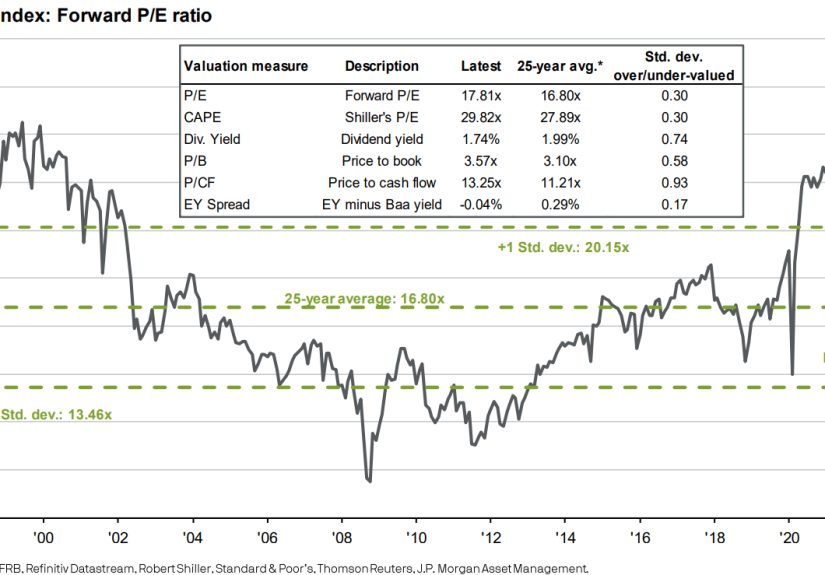
Valuation Gauge #1: Forward P/E (The Market’s “Expected Earnings” Price)
Forward P/E is popular because it tries to price the market based on where profits are headed, not where they’ve been.
Think of it as buying concert tickets based on the band’s next album, not last year’s setlist.
In mid-January 2026, a widely cited estimate for the S&P 500’s forward 12-month P/E is about 22.2.
That matters because it’s not only high in absolute termsit’s also above recent norms. When a forward P/E sits above its longer-run
averages, it suggests investors are comfortable paying a premium for expected growth.
Here’s a simple translation: a forward P/E of 22.2 means investors are paying about $22.20 for $1
of expected earnings over the next year. If earnings growth materializes, that premium can be justified. If earnings disappoint, the
“premium pricing” can feel less like a luxury purchase and more like buyer’s remorse.
Why forward P/E can mislead
- Analysts can be optimisticespecially when the economy looks okay and corporate guidance is upbeat.
- Profit margins fluctuate; a great year can make “forward earnings” look more reliable than they really are.
- Sector concentration matters; a handful of mega-caps can skew index-level valuation upward.
Valuation Gauge #2: Trailing P/E (The “No-Excuses” Price)
Trailing P/E uses actual, already reported earnings. It’s the valuation equivalent of checking what you actually spent on groceries,
not what you planned to spend. In mid-January 2026, the trailing P/E for the S&P 500 has been reported around the low 30s, which is
historically elevated.
A high trailing P/E isn’t automatically badsometimes it reflects a market that expects earnings to rise, which would pull the P/E down over time.
But it does mean the market is priced for a fairly favorable scenario.
Valuation Gauge #3: Shiller CAPE (The “Long Memory” Metric)
The Shiller CAPE (cyclically adjusted P/E) smooths earnings over 10 years and adjusts for inflation. It’s designed to mute
the noise of recessions and booms. Broker education pages often describe it as a way to view valuation through a longer lens
helpful for setting expectations, not for calling the exact top next week.
In January 2026, CAPE readings have been around ~39–40. Historically, that’s extremely highlevels in this neighborhood are
commonly compared with the most expensive episodes of U.S. market history. Media coverage has been blunt: the long-term valuation gauge
is sitting near rarefied territory.
What a high CAPE implies (and what it doesn’t)
- It often implies lower long-run returns than when CAPE is closer to average.
- It does not reliably predict near-term drops. Markets can stay expensive longer than your patience can stay calm.
- It can be influenced by accounting changes and the modern mix of companies (more tech, more intangible assets).
Valuation Gauge #4: Price-to-Sales (When Even Revenue Looks Pricier)
Sales are harder to “massage” than earnings. Companies can tweak expenses, depreciation, or one-time itemsbut revenue is revenue.
That’s why price-to-sales is a favorite reality check when investors worry profits might be temporarily inflated.
Recent readings for the S&P 500’s price-to-sales have been roughly 3.4 in mid-January 2026near record territory by several
published data sets. That’s a fancy way of saying: investors are valuing each dollar of sales more highly than usual.
Valuation Gauge #5: Price-to-Book (Trickier in a Tech-Heavy Market)
Price-to-book compares the market’s price to the net assets on corporate balance sheets. In old-school manufacturing eras, this made intuitive sense:
factories, inventory, equipment. Today’s market is stuffed with companies whose most valuable “assets” are code, brand, networks, and talentthings that
don’t always show up neatly as book value.
Still, price-to-book can serve as a “how frothy is sentiment?” check. And in mid-January 2026, published data has shown the S&P 500 price-to-book
above 5, which is elevated versus typical historical ranges.
Rates Reality Check: Stocks vs. Treasurys (The “Fed Model” Vibe)
Even if you never plan to buy a bond, bond yields matter because they’re the market’s baseline for “what you can earn with less risk.”
When Treasury yields rise, investors often demand better bargains in stocksor at least better future growthto justify equity risk.
In mid-January 2026, the U.S. 10-year Treasury yield has been around the low 4% range in widely used economic datasets. Meanwhile,
the Federal Reserve’s policy rate has been in the 3.50%–3.75% target range. That’s a very different backdrop than the
ultra-low-rate era that made expensive stocks feel “normal.”
Earnings yield vs. bond yield: a simple comparison
Earnings yield is basically “how much earnings you get per dollar invested in the index.” If the S&P 500’s earnings yield is around the mid-3%
range while the 10-year Treasury yields a bit above 4%, stocks are not offering a huge “obvious” yield advantage on this simplified comparison.
That doesn’t mean stocks can’t outperformstocks can grow earnings, bonds don’tbut it does mean investors are paying a premium for growth and durability.
So… Is the Market Expensive Right Now?
Put it all together and the answer looks like this:
By many commonly cited historical valuation measures, the U.S. stock market in mid-January 2026 appears expensive.
Forward P/E is elevated, CAPE is extremely high, price-to-sales is near record levels, and the earnings yield doesn’t tower over bond yields.
If you want a one-sentence takeaway with a little swagger: the market is wearing a designer price tag, and it’s expecting to earn it.
Why Prices Can Stay High Anyway (Yes, Even When Everyone Notices)
If expensive markets always fell immediately, investing would be a lot easierand far less stressful. But markets can remain pricey for long stretches
when a few forces line up:
1) Earnings growth expectations are strong
When analysts expect healthy earnings growth into a new year, a higher forward multiple can look less wild. The idea is simple:
if the “E” rises fast enough, today’s high P/E becomes tomorrow’s merely “kind of high” P/E.
2) AI and mega-cap dominance reshape the index
In recent years, big, profitable, highly liquid companies have carried a lot of market weight. When a small cluster of giants is priced
for rapid innovation, the entire index can look expensiveeven if many smaller stocks aren’t as stretched.
3) Investors may be betting on easier policy later
Market commentary in January 2026 has highlighted expectations around Federal Reserve decisions and how rates might evolve. If investors believe
the rate environment will become friendlier, they can justify paying up today. If that belief changes, valuations can re-rate quickly.
What “Expensive” Means for You (Without the Drama)
An expensive market doesn’t mean “sell everything and move to a cabin.” It usually means:
- Future returns may be more modest than when valuations are low.
- Volatility risk can be higher because there’s less valuation cushion if news disappoints.
- Stock selection and diversification matter morethe easy “everything goes up” phase is less guaranteed.
A Practical Playbook for Investing When Valuations Are High
Keep your time horizon honest
If you need money in the next 1–3 years, valuation matters a lot because you don’t have time to recover from a bad stretch.
If you’re investing for 10–30 years, the bigger risk is often not investing at all.
Use contributions and rebalancing instead of predictions
High valuations are a good moment to lean on process: consistent contributions (like dollar-cost averaging) and periodic rebalancing.
Rebalancing is the polite way of saying “trim what’s run hot and add to what’s lagged,” without pretending you’re a fortune teller.
Broaden exposure beyond the headline winners
When the index is driven by a few superstar names, diversification can mean looking at equal-weight strategies, different sectors,
and even non-U.S. markets (if appropriate for your goals). The objective isn’t to abandon innovationit’s to avoid overpaying for
a single storyline.
Focus on quality and cash flow
In expensive markets, investors often care more about businesses that generate steady cash, maintain strong balance sheets,
and can sustain earnings through economic bumps. “Quality” isn’t a magic shield, but it can help when the market stops being generous.
Watch your behavior, not just the valuation charts
Valuation metrics are numbers. Your behavior is the multiplier. The most common way people lose money in expensive markets isn’t the
metric itselfit’s panic selling after a drop, or FOMO buying after a surge.
Bottom Line
In mid-January 2026, a cluster of widely used indicators suggests U.S. stocks are priced on the expensive side of history.
That’s not a siren telling you to flee. It’s a weather report telling you to pack accordingly: expect choppier conditions, lean on
diversification, keep your plan, and don’t confuse “expensive” with “impossible.”
Real-World Investor Experiences: What It Feels Like to Invest When the Market Looks “Pricy”
Even if you love numbers, investing is still a human sportand expensive markets have a special talent for messing with your brain.
The first “experience” many investors have is the emotional whiplash of watching the market hit new highs while headlines insist it’s
overvalued. You open a chart, see a clean uptrend, and think, “Maybe I should wait.” Then it climbs again, and the waiting starts to
feel less like discipline and more like standing outside a bakery because you’re “not sure” you’re hungry while the smell of fresh
bread does psychological warfare on you.
Another common experience is the “valuation guilt trip.” You read about CAPE ratios and forward multiples, and suddenly every buy order
feels like paying full price. The weird part is that the market doesn’t reward guilt or punish confidence. It rewards time, patience,
and not doing something wildly dramatic because you got spooked by a chart at 1:00 a.m. Many investors learn this the hard way:
the market can stay pricey long enough that sitting in cash becomes its own riskespecially if inflation is still nibbling at your
purchasing power in the background.
Then there’s the “selective memory” experience. When the market is expensive, you start comparing everything to the one time you
almost bought at the perfect moment. You remember the dip you didn’t buy, the rally you didn’t fully participate in, and the
friend who claims they “saw it coming.” (They did not. They saw it coming the way a cat “sees” gravity: by falling off the couch and
acting like it was intentional.) Expensive markets make people rewrite their own history, which is dangerous because it tempts you to
chase a do-over instead of following a plan.
A fourth experience is discovering the difference between “the market” and “your portfolio.” The S&P 500 can look wildly expensive,
yet you might still find reasonably valued areas: different sectors, smaller companies, dividend strategies, value tilts, or simply
holdings that haven’t run as hot. Investors often learn that broad headlines are blunt instruments. A market can be expensive in the
aggregate and still offer pockets of opportunity. The trick is not to turn “pockets of opportunity” into “I will now become a full-time
stock picker because I watched three videos and have opinions.”
Finally, there’s the most important experience: the moment you realize that valuations are best used to set expectations, not to
dictate dramatic all-in/all-out moves. In expensive markets, the smarter shift is often subtle: rebalance a little more diligently,
keep contributions steady, avoid leverage you don’t understand, and build a portfolio you can hold through a drawdown without
emotionally detonating it. If you can do that, you’ve already beaten the hardest opponent in investingyour own impulse to turn every
market headline into an emergency meeting with yourself.